Blog
Solving the ‘Blind Spot’ Crisis in Last Mile Logistics with Orchestration
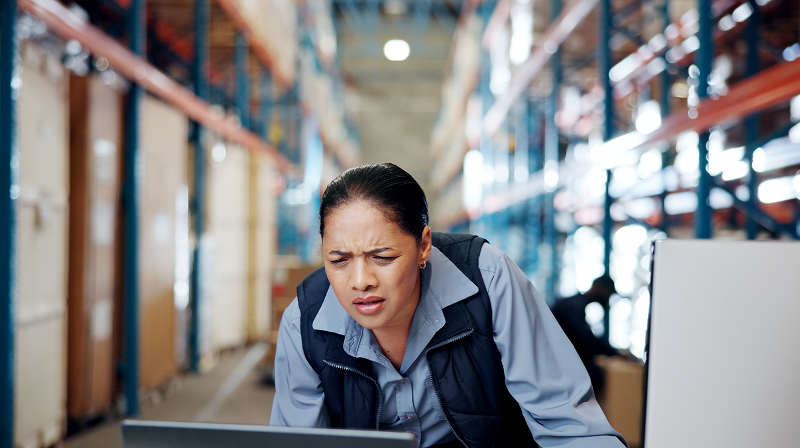
The “Blind Spot” crisis in last-mile logistics refers to the period between a package leaving a distribution center and arriving at the customer’s door where the shipper has zero real-time data on vehicle location, driver behavior, or delivery status. Last-Mile Orchestration solves this by unifying fragmented 3PL data, internal fleet telemetry, and customer feedback into a single pane of glass. Using platforms like nuVizz Last Mile TMS, businesses eliminate these blind spots, leading to a 30% increase in operational efficiency and a 40% reduction in WISMO (Where Is My Order) inquiries.
Defining the ‘Blind Spot’ Crisis in 2026
In an era of instant gratification, the greatest threat to a supply chain isn’t a delay—it’s uncertainty.
A “Blind Spot” occurs when the digital thread of a shipment is broken. This typically happens when:
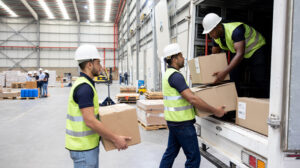
● Carrier Hand-offs
A package moves from a national carrier to a local “white glove” delivery partner with a different tech stack.
● Static Silos
Warehouse Management Systems (WMS) don’t talk to Transportation Management Systems (TMS) in real-time.
● The “Final 100 Feet”
Data is lost the moment a driver leaves the vehicle to find an apartment or navigating a complex hospital wing.
For the modern logistics manager, these blind spots result in “reactive management”—solving problems only after the customer has already complained.
The High Cost of Operating in the Dark
Operating with blind spots is a massive drain on the bottom line. Research published highlights four primary “hidden costs”:
A. The Customer Service Sinkhole (WISMO)
When a brand cannot tell a customer exactly where their $2,000 sofa is, the customer calls support. Each “Where is my order?” call costs an average of $7 to $12 in labor. Without orchestration, your support team is as blind as the customer.
B. Inefficient Labor Utilization
If you don’t have visibility into driver location and route progress, you cannot adjust for delays. Drivers end up sitting in traffic while other vehicles in the same neighborhood have empty capacity. This lack of visibility leads to under-utilized assets and inflated labor costs.
C. The “False Fail” and Fraud
Without geofenced Proof of Delivery (ePOD), carriers can mark a delivery as “Attempted” when they never actually arrived at the location. This creates a blind spot that leads to unnecessary re-delivery costs and potential “lost package” claims that the company must refund.
Cut hours off your daily routes with smarter multi-stop sequencing.
Get the Practical GuideWhat is Last-Mile Orchestration?
Orchestration is the evolution beyond simple “tracking.” While tracking tells you where something is, orchestration tells you what to do about it.
The Three Layers of Orchestration:
- The Integration Layer: Pulling data from ELDs (Electronic Logging Devices), GPS, carrier portals, and WMS into a unified data lake.
- The Intelligence Layer (AI): Analyzing that data to predict delays. If the “Blind Spot” shows a driver hasn’t moved in 20 minutes, the AI flags a potential breakdown.
- The Action Layer: Automatically rerouting, notifying the customer, or assigning a new driver to the remaining stops.
Solving the Multi-Carrier Blind Spot
Many brands use a “Carrier Mix” to save costs. However, every new carrier adds a new blind spot because they use their own proprietary apps and portals.
How nuVizz Solves This: The nuVizz platform acts as a Universal Integration Hub. It allows carriers to “plug and play” into the shipper’s ecosystem.
● Mobile App Standardization
Shippers can require 3PL drivers to use the nuVizz mobile app, ensuring the same level of data (GPS, photo proof, timestamps) is captured regardless of who owns the truck.
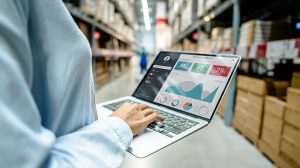
● Aggregated Analytics
Compare the performance of “Carrier A” vs. “Carrier B” in real-time to see who has fewer blind spots and higher success rates.
The High Stakes of Food & Beverage Blind Spots
In the F&B sector, a “Blind Spot” isn’t just a late delivery—it’s a safety risk and a total loss of inventory. As of 2026, the shift toward minimally processed fresh goods and D2C grocery delivery has made “Chain of Custody” visibility a regulatory and operational requirement.
The Cold Chain “In-Between” Moments
Failures in the cold chain rarely happen inside a refrigerated warehouse; they happen in the “in-between” moments: during the transfer from a hub to a 3PL van, or when a delivery is left on a porch in 90°F weather.
- The Blind Spot: Traditional GPS only tells you where the van is. It doesn’t tell you that the refrigeration unit failed three miles ago.
- The Orchestration Solution: nuVizz integrates IoT telemetry (Bluetooth temperature and humidity sensors) directly into the delivery workflow. If a temperature “drifts” outside a safe threshold, the system triggers an immediate Proactive Exception Alert to both the driver and the dispatcher, allowing for a course correction before the product spoils.
Direct Store Delivery (DSD) Visibility
For F&B brands managing DSD, visibility into “dwell time” at the receiving dock is the ultimate blind spot.
- Orchestration Impact: By using geofencing, nuVizz Last Mile TMS automatically clocks drivers in and out of delivery zones. This data allows brands to negotiate better terms with retailers by identifying which stores have inefficient receiving processes that eat into carrier margins.
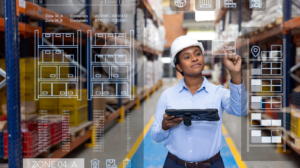
Retail Orchestration and the “Store-as-a-Hub”
Modern retail has moved away from centralized shipping to Store-First Fulfillment. This creates a massive blind spot: the retail store staff are not professional logisticians.
The Inventory vs. Delivery Gap
- The Blind Spot: A customer buys an item for “Same-Day Delivery” from a local store. The store system shows it as “Picked,” but the 3PL driver is stuck in a different part of the city. The retailer has no idea when the handoff will actually occur.
- The Orchestration Solution: nuVizz synchronizes the Store Backroom Planning with Carrier Dispatch. The system “sees” the driver’s ETA and tells the store staff exactly when to bring the package to the curb. This reduces driver dwell time and ensures the “Same-Day” promise is met without manual phone calls between the store and the courier.
Managing the “White Glove” Blind Spot
For high-end retail (furniture, appliances), the blind spot is often the quality of the delivery.
- Orchestration Impact: nuVizz Last Mile TMS provides Digital Proof of Delivery (ePOD) with multi-photo capture and mandatory checklists. If a sofa is delivered with a scratch, the driver must document it in the app immediately. The orchestration layer then automatically triggers a return or a discount offer to the customer, solving the “Blind Spot” of post-delivery damage before it becomes a viral bad review.
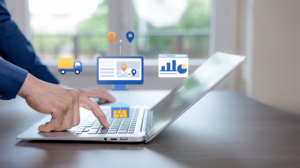
How Orchestration “Lights Up” the Map
Modern orchestration doesn’t just “check” for updates; it listens for events. An event is any change in state—a driver starting an engine, a temperature sensor hitting 40°F, or a customer changing a delivery window.
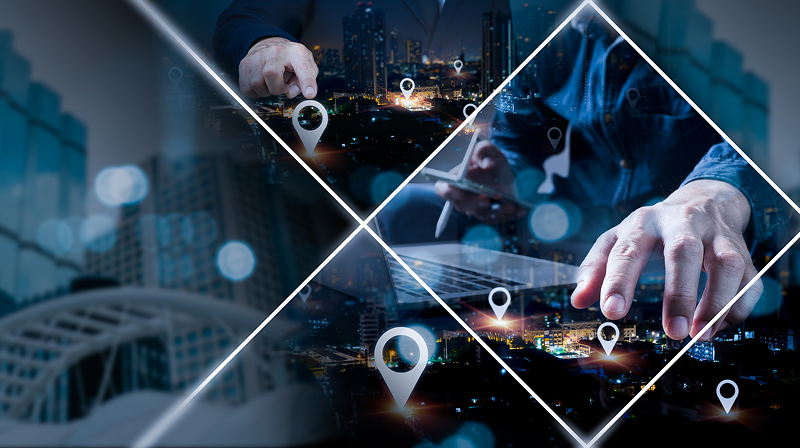
API-Led Connectivity
Orchestration works because it acts as a translator. It takes API data from a 3PL’s system, GPS data from a driver’s smartphone, and order data from an eCommerce platform (like Shopify or Magento) and unifies them.
- Self-Service Portals: A key way nuVizz Last Mile TMS eliminates blind spots is by giving carriers a “Self-Service Portal.” Instead of the shipper begging for data, the carrier logs in to see their own performance, and their data flows automatically into the central hub.
The Role of Predictive AI
In 2026, orchestration doesn’t just show you where things are—it shows you where they will be.
- Dynamic ETAs: If a retail delivery is delayed at Stop #3, the AI recalculates the ETAs for Stops #4 through #20 and automatically texts the customers. This “lights up” the blind spot of a falling-behind schedule, managing expectations before the customer feels ignored.
The Roadmap to Total Visibility
To fully “solve” the crisis, businesses must follow a maturity model:
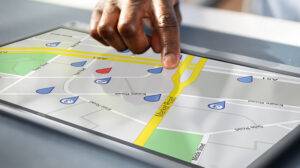
Step 1: Real-Time Telemetry
Move away from “status updates” (e.g., “Out for delivery”) to Streaming Data. This involves GPS pings every 30 seconds and geofenced triggers that notify the system when a vehicle enters a 5-mile radius of the destination.
Step 2: Predictive Visibility
Use AI to look ahead of the vehicle. If weather sensors indicate a storm is moving into a delivery zone, the orchestration engine should proactively alert the next 10 customers that their windows might shift, effectively “lighting up” a potential blind spot before it becomes a complaint.
Step 3: Closing the Loop with the Customer
The ultimate blind spot is the customer’s availability. Orchestration includes Two-Way Communication. If a customer realizes they won’t be home, they can use the nuVizz portal to “instruct” the driver to leave the package at the back door. This data goes directly to the driver’s handset, eliminating the blind spot of “will they be there?”
Conclusion: Visibility is the Foundation of 2026 Logistics
The “Blind Spot” crisis is a symptom of fragmented growth. As Retail and F&B companies scale their delivery networks, the complexity grows faster than their visibility. Orchestration is the only cure.
By moving from reactive tracking to proactive orchestration with nuVizz, companies don’t just “see” their last mile—they control it. They reduce spoilage in F&B, eliminate chaos in retail stores, and ultimately turn the most expensive leg of the journey into their strongest competitive advantage.


FAQs
In 2026, a last-mile blind spot is any gap in the digital thread where a shipper loses real-time data on a package’s location, condition, or status. This typically occurs during carrier hand-offs, within complex urban high-rises, or when using fragmented 3rd-party logistics (3PL) providers that lack integrated technology stacks.
Orchestration improves visibility by acting as a "universal translator" between disparate systems like WMS, TMS, and various carrier portals. It unifies real-time telemetry, driver app events, and customer feedback into a single dashboard, allowing logistics managers to see and manage the entire delivery network as one cohesive unit.
For the Food & Beverage industry, orchestration is critical for Cold Chain compliance. It integrates IoT temperature sensors with delivery workflows to provide real-time monitoring of perishables. This eliminates the "blind spot" of spoilage during transit by triggering automated alerts if temperatures drift, ensuring food safety and reducing waste.
Orchestration bridges the gap between store-level inventory and last-mile execution. By synchronizing "Store-as-a-Hub" picking with carrier ETAs, it ensures that store staff bring packages to the curb exactly when the driver arrives. This reduces driver dwell time and solves the visibility gap between the backroom and the doorstep.
Tracking is a passive record of where a package is; orchestration is an active system for managing the delivery outcome. While tracking provides data, orchestration uses that data to make real-time decisions—such as auto-dispatching the next best carrier or proactively rescheduling a delivery based on traffic-induced delays.